
What Numbers Will a Buyer or Private Equity Group Ask for Before Valuing Your Practice, and Can You Produce Them Today?
Buyers and private equity groups will ask for normalized EBITDA plus the operational numbers behind it: new patient trend by source, patient retention, provider concentration,…
Read the article →
Are Patients Finding Your Practice Through ChatGPT and AI Search, and How Do You Know If Those Visits Turn Into Booked Appointments?
Yes, some patients are likely already finding your practice through ChatGPT, Perplexity, Gemini and Google AI Overviews. You can confirm it by checking referral sources in your…
Read the article →
Did Your Last Fee Increase Cost You Patients? How to Tell If a Price Change Hurt Retention
To find out whether a fee increase cost you patients, compare four metrics in a fixed window before and after the change: return-visit rate, rebooking rate, cancellation and…
Read the article →
How Do You Know If a New Competitor Nearby Is Taking Your Patients (Before It Shows Up in Revenue)?
You can spot a competitor taking patients months before revenue drops by watching four signals together: new patient decline by zip code, fewer branded search inquiries, rising…
Read the article →
Is Your Multi-Location Practice Actually Growing, or Is Your Newest Location Hiding Flat Results Everywhere Else?
To know whether your practice is growing, split total revenue growth into two parts. Same-location practice growth compares only locations open 12 months or longer against their…
Read the article →
Why Does One of Your Locations Get Far More Google Reviews Than Another With the Same Patient Volume?
Two locations with the same patient volume rarely earn the same number of Google reviews, because reviews come from habits, not headcount. The location that asks consistently, at…
Read the article →
Do Your Marketing Agency's Lead Reports Match the Patients Who Actually Show Up at Your Practice?
Usually, no. Marketing agency lead reporting counts calls, clicks and form fills, while your practice runs on patients who book, arrive and return. The two numbers drift apart…
Read the article →
Where Do Your Patients Actually Live, and Is Your Marketing Spending Money Outside the Neighborhoods That Book?
Your best patients probably cluster in a handful of zip codes, and your marketing likely reaches well beyond them. A patient zip code analysis compares where booked, returning…
Read the article →
How Do You Know If a New Provider Is Ramping Up Fast Enough (or Quietly Costing Your Practice Money)?
You know a new provider ramp up is on track when five numbers move in the right direction month over month: schedule fill rate, the share of truly new patients, case acceptance,…
Read the article →
What Are Your Patients' Negative Reviews Actually Complaining About, and Is It the Same Problem at Every Location?
Most negative patient reviews fall into a few recurring patient review complaint themes: communication, wait times, staff interactions, and billing. These themes rarely show up…
Read the article →
How Do You Know If Your Practice Is Quietly Losing Patients When They Move Between Locations or Providers Mid-Treatment?
You find patient transfer drop-off by comparing treatment plan completion rates for transferred patients against non-transferred patients, measuring the gap in days between the…
Read the article →
How Do You Know If Your Practice Is Losing Patients When Staff Turnover Hits the Front Desk?
You know your practice is losing patients after front desk turnover by comparing four metrics across the 60 days before and the 60 days after the departure: call answer rate, lead…
Read the article →
Which Months Does Your Practice Predictably Slow Down, and How Far Ahead Should You Be Marketing for Them?
Most practices slow in late June through August and again from mid December through early January, with a secondary dip in March once post New Year momentum fades. To fix a slow…
Read the article →
How Do You Know If Your Website Traffic Is Turning Into Actual Appointments (or Just Filling Out Forms Nobody Works)?
You know your website traffic is converting only when you can trace a single web session forward to a booked appointment that the patient actually arrived for. Count four numbers:…
Read the article →
Which Marketing Leads Never Get Called Back the Same Day (and How Much That Delay Costs You)?
The leads that never get a same day callback are almost always the ones arriving outside the front desk's reactive window: web forms submitted after 4pm, weekend and holiday…
Read the article →
How Do You Know If Your Practice Is Losing Patients to a Broken Handoff Between Consult and Treatment Coordinator?
You know the handoff is broken when your consult to treatment conversion rate varies by coordinator rather than by case type. If two coordinators see similar diagnoses and one…
Read the article →
How Do You Know If Your Practice Is Losing Patients Between Approval and the First Visit? Tracking the Booked-to-Arrived Gap
You know by measuring the booked-to-arrived rate for brand-new patients separately from returning patients. Divide first-visit arrivals by first-visit bookings for a rolling 30…
Read the article →
How Do You Know If Your Practice Is Losing Patients to Hold Times and Callback Gaps After Hours?
You know your practice is losing patients when you match call logs and web form timestamps against your schedule and find inquiries that arrived outside staffed hours or abandoned…
Read the article →
How Do You Know If Your Practice Is Losing Money to Insurance Verification Errors Before the Patient Ever Sits Down?
You know by measuring three things: the percentage of appointments verified before arrival, the hours between booking and completed verification, and the share of same-day…
Read the article →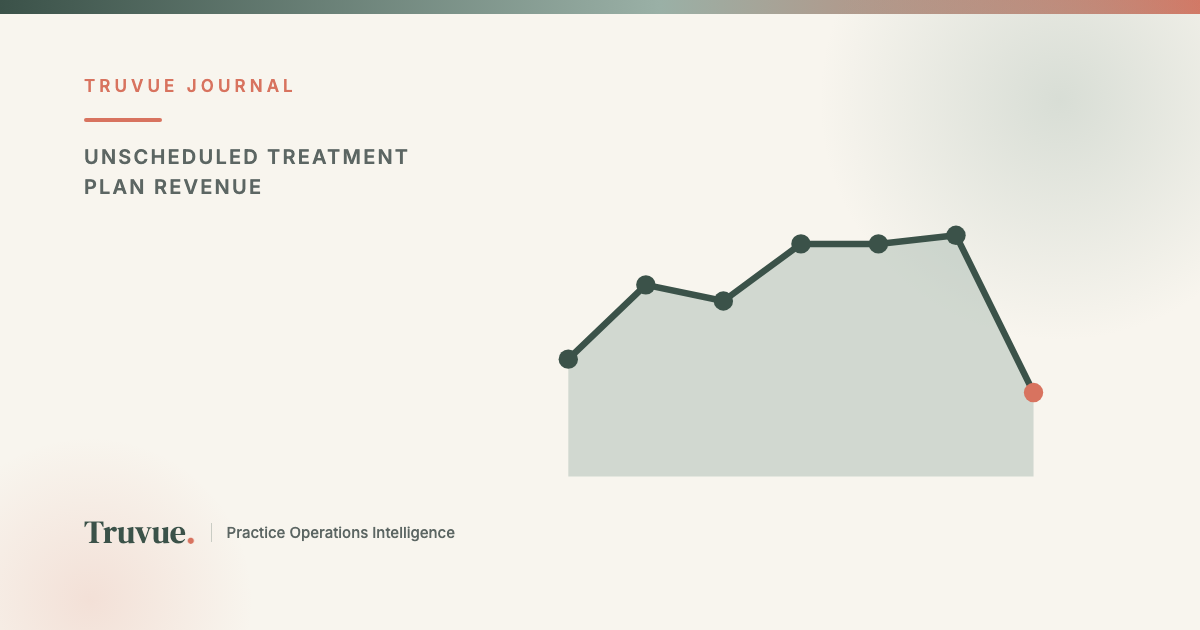
How Much Revenue Is Sitting in Unscheduled Treatment Plans (and Which Provider's Recommendations Never Get Booked)?
Most practices are carrying between two and six months of production in unscheduled treatment plans: work that was diagnosed, presented, and then never booked. To size it, pull…
Read the article →
How Do You Know If Your Practice Depends Too Much on One Referring Physician (and What Happens If That Relationship Ends)?
A practice has dangerous referring physician concentration when a single provider or office accounts for more than 15 to 20 percent of new patient volume or downstream revenue. If…
Read the article →
How Do You Know If Your Practice Is Losing Money to Appointment Cancellations You Never Refilled?
Most practices track their cancellation rate but ignore the metric that actually determines revenue impact: the refill rate , or the percentage of canceled slots that get rebooked…
Read the article →
How Do You Know If Your Practice Is Overspending on Discounts and Promotions to Fill the Schedule?
Practice discount profitability depends on one question most owners never ask: did the promotion produce patients who stayed and accepted treatment at full fee, or did it simply…
Read the article →
How Do You Know If Your Practice Is Too Dependent on One Insurance Payer (and What Happens When Their Reimbursement Drops)?
Insurance payer concentration risk exists when a single payer accounts for more than 25% to 30% of a practice's total revenue. If that payer cuts reimbursement rates, delays…
Read the article →
How Do You Know If Your Best Provider's Schedule Is Booked Out Too Far (and Driving Patients to Competitors)?
A provider schedule booked out three or more weeks signals a hidden revenue leak. When your highest-demand clinician has no openings while other providers sit with gaps, patients…
Read the article →
How Do You Know If Your Patients Actually Have a Preferred Provider (or Just Book Whoever's Available)?
Patient provider loyalty means a measurable share of your active patients consistently rebook with the same clinician visit after visit rather than accepting the first open slot.…
Read the article →
How Do You Know If Your Practice Is Too Reliant on New Patients Instead of Existing Ones?
A practice that depends on new patients for the majority of its revenue is spending more to earn less. The probability of an existing patient returning for services is 60% to 70%,…
Read the article →
How Do You Know If Your Practice Depends Too Much on One Provider (and What Happens If They Leave)?
Provider concentration risk exists when a single clinician accounts for a disproportionate share of your practice's revenue, patient volume, or referral relationships. If that…
Read the article →
How Do You Know If a Marketing Channel Stopped Working Before You've Wasted a Full Quarter's Budget?
You detect marketing channel decline detection by monitoring three leading indicators weekly, not monthly: rising cost per inquiry, falling inquiry-to-booking conversion rate, and…
Read the article →
How Do You Know If Your Phones Are Being Answered (or Going Straight to Voicemail During Business Hours)?
Most medical practices have no reliable way to measure missed patient phone calls. The average independent practice sends roughly 23% of inbound calls to voicemail or lets them…
Read the article →
How Do You Know If a Patient Booked From Insurance vs. Your Marketing (and Why It Changes Everything)?
The difference between insurance vs marketing patients is whether a patient found your practice through an insurance directory or through your own marketing efforts. Insurance…
Read the article →
How Do You Know If Your Best Patients Are Coming Back Often Enough (or Slowly Slipping Away)?
Track patient visit frequency by comparing the clinically recommended visit interval against each patient's actual return interval. When the gap between those two numbers widens,…
Read the article →
How Long Should It Take Patients to Get an Appointment, and Is Your Wait Time Sending Them to a Competitor?
The ideal patient appointment wait time for a new primary care visit is three to five days or fewer. Industry data shows the actual average has ballooned to roughly 26 days, and…
Read the article →
How Much Is Each Empty Appointment Slot Actually Costing Your Practice?
Each empty appointment slot costs a healthcare practice between $150 and $800 in lost production, depending on specialty and provider type. When you multiply that figure by a…
Read the article →
How Do You Know If Two Locations Are Actually the Same Practice to Patients (or Quietly Competing With Each Other)?
Multi-location patient overlap occurs when two or more practice sites draw from the same patient pool, meaning expansion is redistributing existing patients rather than capturing…
Read the article →
How Do You Compare Performance Across Your Locations When Every One Reports Numbers Differently?
Multi-location performance benchmarking only works when every site measures the same metrics the same way. Without standardized definitions, collection methods, and reporting…
Read the article →
How Long Does It Take to Answer a New Patient Inquiry Before You Lose the Booking?
New patient response time determines whether an inquiry becomes a booking or a lost opportunity. Research shows that contacting a lead within one minute can lift conversion rates…
Read the article →
Which Patient Referral Sources Are Worth Rewarding, and Which Are Costing You Money?
Effective patient referral source tracking requires measuring each source by downstream retention and lifetime value, not just first-visit volume. Practices that score referral…
Read the article →
Which Patients Are About to Leave Your Practice, and How Do You Spot Them Before They Go?
The most reliable patient churn warning signs are missed recall appointments, lengthening gaps between visits, unbooked treatment plans, and no next appointment on the schedule.…
Read the article →
How Do You Know If Your Google Business Profile Is Costing You Patients (Without Realizing It)?
A Google Business Profile in healthcare is the single most powerful local visibility asset your practice controls, and when it is underoptimized or stale, it silently suppresses…
Read the article →
Which Numbers Should Be on a Practice Owner's Weekly Dashboard (and Which Ones Are Just Noise)?
A practice owner weekly dashboard should track six to eight leading indicators: new patient flow, booked-to-completed rate, lead response time, production per provider, recall and…
Read the article →
How Do You Know If Your Patient Scheduling Is Leaving Money on the Table with Unfilled Chair Time?
You measure provider schedule utilization by comparing actual booked appointment hours against total available provider or chair hours across every location and clinician. If your…
Read the article →
How Do You Know If Your Recall System Is Actually Working (or Silently Bleeding Revenue)?
Here is a number that should keep every practice owner up at night: the average dental or medical practice loses between 10% and 15% of its active patient base each year simply…
Read the article →
How Do You Know If Your Front Desk Is Understaffed (Before You Start Losing Patients)?
Your practice did not lose that new patient because of a bad Google review or a competitor's flashy ad. You lost them because nobody picked up the phone. Every day, healthcare…
Read the article →
How Do You Know If Your Marketing Budget Is Too High (or Too Low) for the Number of Patients You Can Actually Handle?
Here is a scenario that plays out in practices every week: a dental office spends $12,000 a month on Google Ads, generates 60 new patient inquiries, and books only 35 because the…
Read the article →
Where Do Most of My New Patient Inquiries Actually Get Lost Between the First Call and the Booked Appointment?
Your marketing is working. The phone is ringing, web forms are getting filled out, and social media messages are coming in. But somehow, your schedule still has gaps and your…
Read the article →
How Do You Know If Your Practice Is Ready to Open a Second Location (Before the Numbers Force the Decision)?
Your schedule is packed. Patients are waiting weeks for appointments. Your team keeps saying, "We need more room." It feels like the universe is telling you to expand. But here is…
Read the article →
How Long Does It Really Take a New Patient to Become Profitable, and How Do You Speed It Up?
Most practice owners can tell you what they spend to acquire a new patient. Far fewer can tell you how long it takes before that patient actually pays back the investment. This…
Read the article →
Which Provider in My Practice Is Actually the Most Profitable (and Why Volume Doesn't Tell You)?
Your busiest provider sees 30 patients a day. Your quietest sees 18. So the first one is your most profitable, right? Not necessarily. When you dig into provider profitability by…
Read the article →
Which Front-Desk Metrics Actually Predict Whether a Practice Will Grow?
Your marketing budget is bringing new patients to the door, but most of them never walk through it. The real bottleneck is not your website, your ad spend, or your clinical…
Read the article →
Why Do New Patients Book Once and Never Come Back? How to Find and Fix First-Visit Drop-Off
Your practice spent hundreds of dollars acquiring that new patient. They booked, they showed up, they sat in your chair or on your exam table. And then they vanished. No second…
Read the article →
Why Is My Practice Busy but Not Profitable? How to Spot the Gap Between Patient Volume and Revenue
Your schedule is packed. Your waiting room is full. Your team is working harder than ever. Yet somehow, when you look at your financials at the end of the month, the numbers tell…
Read the article →
Which Marketing Channels Actually Bring in High-Value Patients (Not Just More Patients)?
Your Google Ads dashboard says you generated 200 new patient leads last month. Your front desk says half of them never showed up, a quarter came in for a single discounted visit,…
Read the article →
What's a Healthy Patient No-Show Rate, and How Do You Actually Lower It?
Every empty chair in your practice has a price tag. A single missed appointment costs an estimated $200 on average , and across the U.S. healthcare system, patient no-shows drain…
Read the article →
How Many New Patients Do You Actually Need Each Month to Hit Your Revenue Goal?
Most practice owners set ambitious revenue targets each year but never reverse-engineer the one number that actually drives those targets: the exact count of new patients they…
Read the article →
Why Online Reviews Are a Revenue Lever for Practices
Here is a number that should keep every practice owner up at night: nearly 72% of patients say online reviews are their first step when choosing a new healthcare provider. That…
Read the article →
Patient Reactivation: Turning Lapsed Patients into Revenue
Your practice already has a goldmine of untapped revenue sitting in your patient database. Every lapsed patient represents a relationship you have already invested in, a person…
Read the article →
Cost Per New Patient: The Metric Every Owner Should Track
Your practice spent $12,000 on marketing last month. You got 30 new patients. That sounds like a win, right? But what if 25 of those patients came from referrals you would have…
Read the article →
Referral Leakage: How Practices Lose Revenue, and How to Stop It
Every time a patient receives a referral from your practice and never follows through, or ends up at an out-of-network provider, your practice loses revenue it never even knew it…
Read the article →
How Multi-Location Practices Get a Single Source of Truth
Running one profitable practice is hard enough. Running three, five, or fifteen locations while relying on separate spreadsheets, disconnected dashboards, and site-level reports…
Read the article →
What Is Patient Attribution, and Why It Matters
Every month, new patients walk through your doors. Some found you on Google. Others were referred by a specialist down the street. A few clicked on a Facebook ad they saw at 11…
Read the article →
How Healthcare Practices Track Marketing ROI
Your practice spent $15,000 on Google Ads last month, $5,000 on social media campaigns, and $3,000 on a local SEO agency. Leadership wants to know which channel is actually…
Read the article →
What Is Practice Operations Intelligence?
Your EMR tracks what happens in the exam room. Your billing software tracks what gets paid. Your scheduling tool tracks who shows up. But what tracks whether your practice is…
Read the article →